


The ELK (Elasticsearch, Logstash, Kibana) stack is a collection of open-source tools from Elastic.co that form a data ingestion, search, analysis, and visualization platform. The Elastic Stack is the next evolution of the ELK stack and now includes a component called Beats (which is a family of lightweight and single-purpose data shippers). In this blog, we will automate the Elasticsearch Search API to rapidly create canned and shareable threat-hunting tools for you and your team. We will use the Packetbeat data shipper for easy setup and access to network data such as low-level DNS packet attributes and IP flow data.
ELK Stack Automation and APIs
As always, when diving into any API, the first concerns tend to be:
Where and what sort of documentation does the API have?
What specific endpoint(s) can I access?
How do I authenticate against the API?
Are there any prerequisites, limitations, or ‘gotchas’ ?
What tooling can I use to quickly prototype and test?
Elasticsearch API Documentation
The current documentation version is 7.9 at the time of writing:
Main Elastic Stack documentation hub here.
Elasticsearch REST API here.
Logstash REST APIs here.
Beats reference here.
- Filebeat reference here.
- Packetbeat reference here.
Kibana REST API here.
Elasticsearch API Endpoint(s)
Elasticsearch has an extensive and rich set of APIs for all functions. This is because the UI (User Interface) itself uses the APIs. We will be using the Elasticsearch Search API for our threat hunting, and so will interact almost entirely with this specific API endpoint:
/[target_index]/_searchOur indexes will contain the name ‘packetbeat’ and the format also includes the current date (this is covered in the installation setup). By using a wildcard '*' our API endpoint will cover all Packetbeat named indexes:
/packetbeat-*/_searchWe will also be generating API keys via the Elasticsearch Security API endpoint at:
/_security/api-keyElasticsearch API Authentication
There are three distinct ways to authenticate to the Elasticsearch API (once authentication is enabled). They include:
Basic HTTP authentication
and token-based (which can be via an API key or Oauth2.0 tokens).
Elasticsearch Search API Limitations
The Search API returns a maximum of 100 pages, a maximum of 1000 results per page, and a maximum of 10,000 document results per query, which is a limitation of the default Elasticsearch result window.
Note: There is very little security-enabled ‘out-of-the-box’ with the Elastic Stack when using the basic/trial install. This makes it trivial to get started but can leave your data and endpoints exposed unless you harden the configuration.
Tooling
cURL on the CLI is one way to test our authenticated requests and subsequent calls. Postman has a fully-fledged GUI, and of course, you can use your preferred language of choice to make calls to the API. Today we will be going further and building useful security workflows using Tines. Tines enables rapid, reusable, and shareable workflows without delving into code (due to its visual builder). You can quickly register for the free Community Edition of Tines here.
Quick Setup Up
We’ve set up an Ubuntu 20.04 server on AWS using a t3.large instance (to accommodate the system and JVM requirements) and then followed DigitalOcean’s excellent Elasticsearch installation tutorial. We will, however, be enabling security for authentication and also adding an additional Beats shipper called PacketBeat (over and above just Filebeat). We did not generate custom certificates and are instead using Cloudflare’s free and flexible TLS/SSL offering combined with Nginx’s simple reverse proxy on the Elastic Stack host. This ensures our primary transports are encrypted across the untrusted Internet, i.e. the ability to use ‘https’ for data in transit.
Note: If you are running a production instance of the Elastic Stack, we recommend you follow all their security guidance, including the use of correct certificates for full end-to-end encryption.
Step 1. Enable Basic Security
It is recommended that system-level accounts are reset and recorded as per the CLI tool “elasticsearch-setup-passwords”. To enable basic authentication and API key generation, there are some additional updates required in ‘elasticsearch.yml’ (and don’t forget to restart services afterward!).
xpack.security.enabled: true
xpack.security.authc.api_key.enabled: true
xpack.security.authc.api_key.cache.ttl: 7dThe above change also has knock-on effects with Beats (i.e. filebeat.yml / packetbeat.yml) and Kibana configurations. Usernames and passwords are now required in each component's configuration files, e.g., for ‘filebeat.yml’ (below) running on the Elastic Stack. You would also need to change the host’s field if sending from a remote rather than a local data shipper.
output.logstash:
  # The Logstash hosts
  hosts: ["localhost:5044"]
  username: "[beats_user]"
  password: "[beats_password]"
Beats : “filebeat.yml” configuration for authentication
elasticsearch.username: "kibana"
elasticsearch.password: "[kibana_password]"
xpack.security.encryptionKey: "[random_32_char_alphanumeric_string]"
Kibana : additional ‘kibana.yml’ configuration for authentication
Step 2. Packetbeat
In this guide, we also install the Packetbeat data shipper to enable us to query low-level DNS attributes and other IP packet fields. You can use the same Beats user you set up with the role of index ‘writer’ (from the DigitalOcean install tutorial) if you wish but also remember to run the setup, including that of telling Kibana to configure the right index policy, templates, and dashboards.
Note: You might need to manually supply the ‘elastic’ username and password on the CLI during setup, as you now should have authentication enabled.
Step 3. Minting API Tokens
We can create an API key from the CLI using something like cURL but let’s take a quick look at using the Kibana Dev Console under ‘Management/Dev Tools’ (as we should already have logged in to Kibana using the primary “elastic” user). Let’s create an API key valid for 14 days.
POST /_security/api_key
{
  "name": "tines-blog-api-key",
  "expiration": "14d",
  "role_descriptors": {
    "role-a": {
      "cluster": ["all"],
      "index": [
        {
          "names": ["*"],
          "privileges": ["read"]
        }
      ]
    }
  }
}Kibana Dev Console: Creating an API key to use as a subsequent token
And the subsequent response gives us all we need to create our token.
{
  "id" : "mmlgaXUBCPRHFVwFPR9x",
  "name" : "tines-blog-api-key",
  "expiration" : 1605000316252,
  "api_key" : "PyFdtuMKSn-5oBiNUEoUhA"
}
Kibana Dev Console: Response with our key ID and actual key value
To generate a usable token (based upon our API key), we need to combine the “id” and the “api_key” with a colon ‘:’ and then Base64 encode the resulting string. Here we use Ruby’s interactive console (irb) to achieve this (though you can use the CLI on OSX or *nix to accomplish this also, as shown in the second example below).
irb(main):001:0> require 'base64'
=> true
irb(main):002:0> Base64.encode64('mmlgaXUBCPRHFVwFPR9x:PyFdtuMKSn-5oBiNUEoUhA')
=> "bW1sZ2FYVUJDUFJIRlZ3RlBSOXg6UHlGZHR1TUtTbi01b0JpTlVFb1VoQQ==\n"
Ruby (irb): Quickly generate a Base64 encoded string
irb(main):001:0>echo "mmlgaXUBCPRHFVwFPR9x:PyFdtuMKSn-5oBiNUEoUhA" | base64
bW1sZ2FYVUJDUFJIRlZ3RlBSOXg6UHlGZHR1TUtTbi01b0JpTlVFb1VoQQo=
*Nix: Equivalent to generate a Base64 encoded string on the command line
We now have our token (ending in ‘==’ or “=” meaning it was padded due to a short length). We can use it with our API calls by submitting the token as a header in our requests as per below:
irb(main):001:0>Authorization: ApiKey bW1sZ2FYVUJDUFJIRlZ3RlBSOXg6UHlGZHR1TUtTbi01b0JpTlVFb1VoQQ==Required Header for authentication per API call (as Elasticsearch is stateless)
Putting it All Together
Let’s now create a simple threat hunting scenario leveraging Elasticsearch and using Tines for the workflow. We can then also expose our workflow to our colleagues as a canned query. You could modify it in many other ways as part of closed-loop automation (including querying or writing to a whole host of other platforms or services), but let’s focus on looking for DNS queries and traffic to dodgy domains first!
First, let’s focus on the API calls we make to Elasticsearch, and then we can expand to explain the other Action types used for additional functionality. The two main API queries we are going to send to Elasticsearch are to ask for and return all hosts that:
made DNS queries about a specific domain
sent IP traffic to an IP address (IPv4/IPv6) that resolved in the DNS answer
As noted previously, the UI depends on the API so the basic search terms for fields map from Kibana Query Language (KQL) usage to our JSON based API calls (with the exception of how we structure any conditional logic). Here we do a test to look for entries related to “cisco.com”.
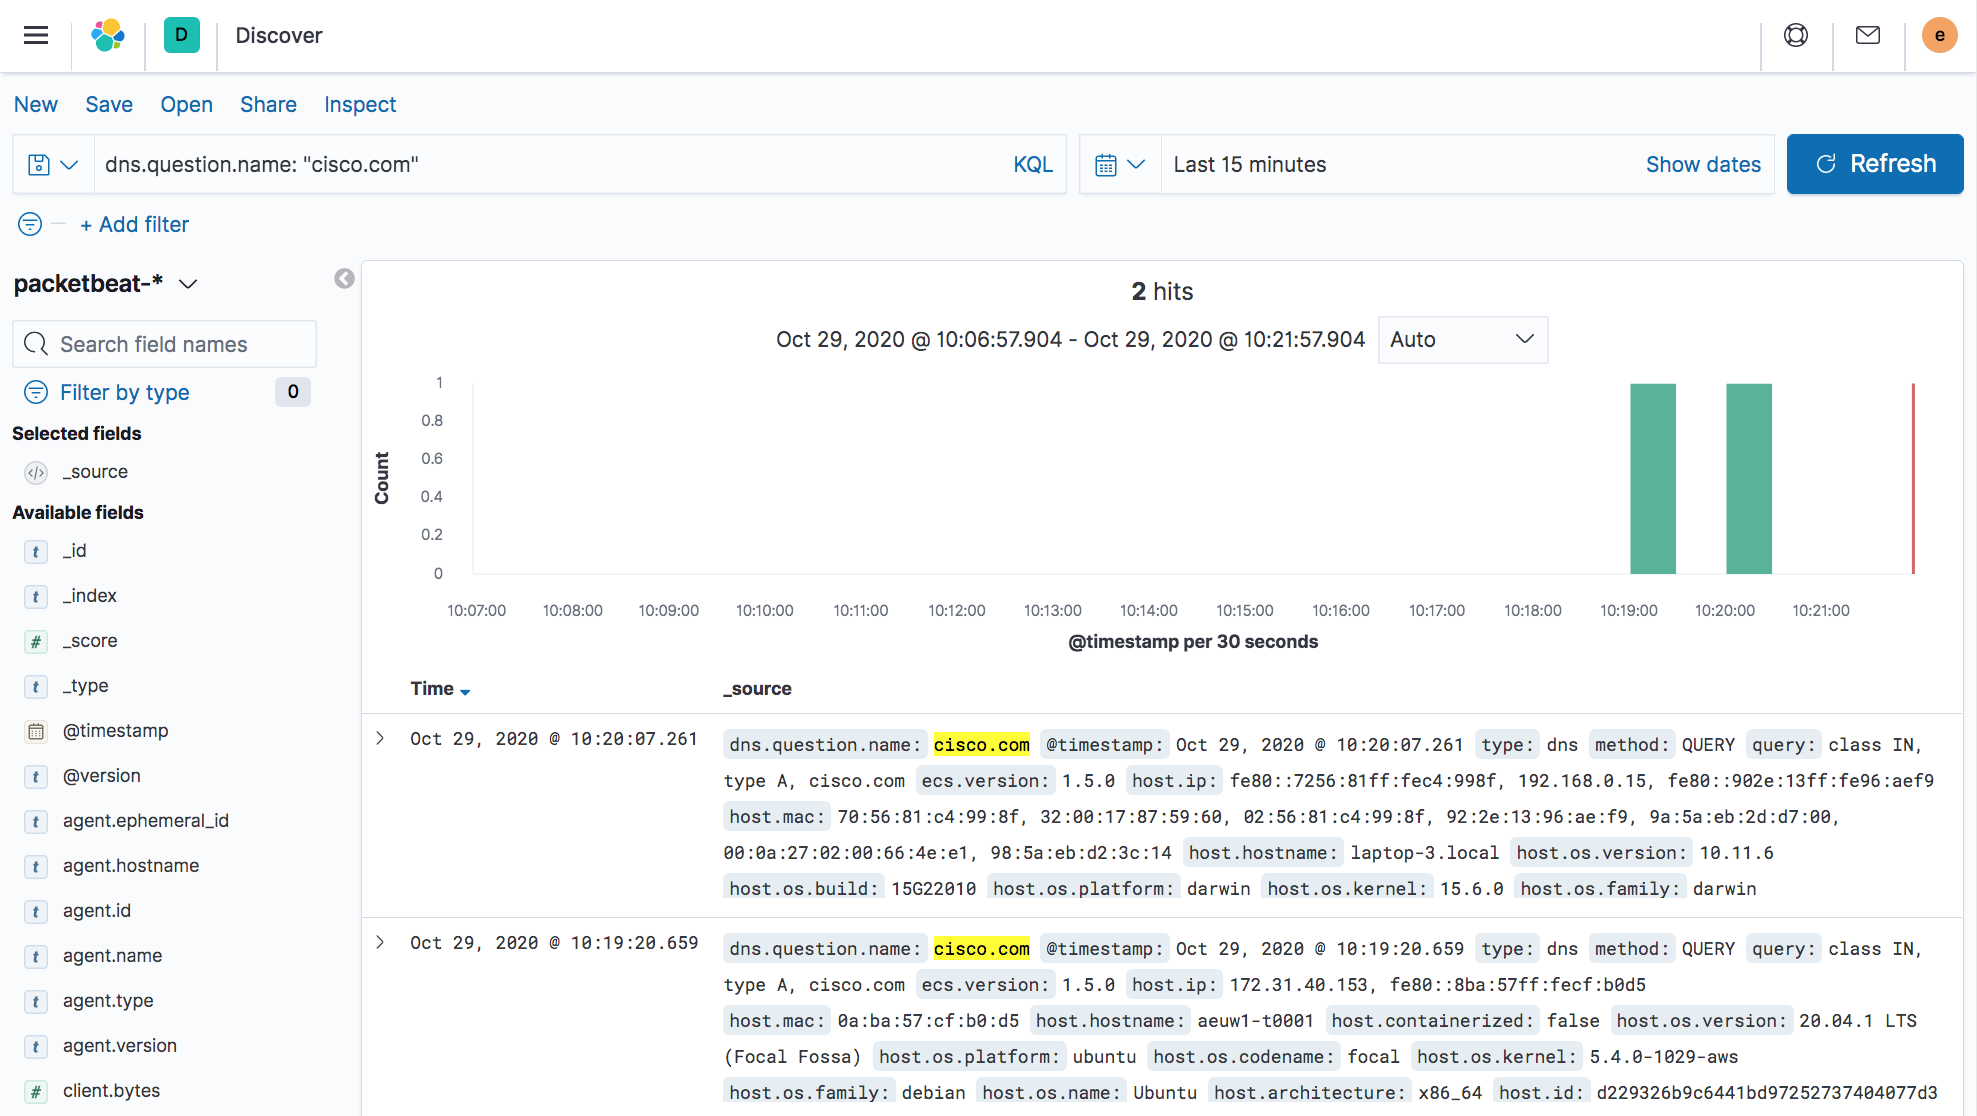
Kibana : Simple UI query across all hosts.
Kibana : Simple UI query across all hosts.
To answer the second question regarding IP traffic, we will need first to perform some DNS resolution for IPv4 and IPv6 RRs (Resource Records). This is where we will additionally ask Cloudflare’s DoH (DNS over HTTPS) for some answers so we can query the raw IPs in Elasticsearch.
Note: For our examples, we’re using ‘cisco.com’ as the domain name queried. It is not in any way “bad” but simply has both IPv4 A and IPv6 AAAA resource records. Any domain will, of course, work in our automation (such as the WannaCry domain name www[.]iuqerfsodp9ifjaposdfjhgosurijfaewrwergwea[.]com).
If we drag an Elasticsearch Action onto our Tines Storyboard, we can see that it consists of JSON at the backend. It submits authentication and payload fields to our Elasticsearch Packetbeat index’s ‘_search’ endpoint. It includes all our Packetbeat indexes due to the ‘*’ asterisk glob pattern. This could be further refined, but we will use the ‘range’ term to limit the window of time queried.

Tines : Elasticsearch Packetbeat DNS query agent.
{
  "url": "https://{{RESOURCE.elasticsearch}}/packetbeat-*/_search",
  "content_type": "json",
  "method": "post",
  "payload": {
    "size": 1000,
    "query": {
      "bool": {
        "must": [
          {
            "term": {
              "dns.question.name": "cisco.com"
            }
          },
          {
            "range": {
              "@timestamp": {
                "gte": "now-4h"
              }
            }
          }
        ]
      }
    },
    "_source": [
      "host.hostname",
      "host.ip",
      "host.os.name"
    ]
  },
  "headers": {
    "Authorization": "ApiKey {{CREDENTIAL.elasticsearch}}"
  }
}
Tines: JSON behind an HTTP Action
Note: The quoted endpoint can be tweaked to only include the current day’s index if so desired, but for now, we will use our time ‘range’ to define how far back to look. You can see that we have special fields for ‘resource’ and ‘credential’, which are configured elsewhere in Tines (so they can be easily reused and safely stored).
When we run ‘▷’ this Action, we get the following response in our events:
{
  "elasticsearch_packetbeat_index_dns_query": {
    "body": {
      "took": 1369,
      "timed_out": false,
      "_shards": {...},
      "hits": {
        "total": {
          "value":7,
          "relation":"eq"
        },
        "max_score": 10.150651,
        "hits": [
          {...},
          {...},
          {...},
          {...},
          {...},
          {...},
          {
            "_index": "packetbeat-7.9.2-2020.10.28",
            "_type": "_doc",
            "_id": "g3OjbnUBCPRHFVwF7Fjp",
            "_score": 3.5084372,
            "_source": {
              "host": {
                "hostname": "aeuw1-t0001",
                "os": {
                  "name": "Ubuntu"
                },
                "ip": [
                  "172.31.40.153",
                  "fe80::8ba:57ff:fecf:b0d5"
                ]
              }
            }
          }
        ]
      }
    },
    "headers": {...},
    "status": 200
  }
}
As you can see, we received seven hits, one of them being an Ubuntu server called ‘aeuw1-t0001’.
Our second API call to Elasticsearch is very similar. It only uses different values in the ‘term’ field, such as ‘destination.ip’ using an array of IP addresses rather than the term ‘dns.question.name’ and a single string.

Tines : Elasticsearch Packetbeat IP traffic query agent using ‘destination.ip’.
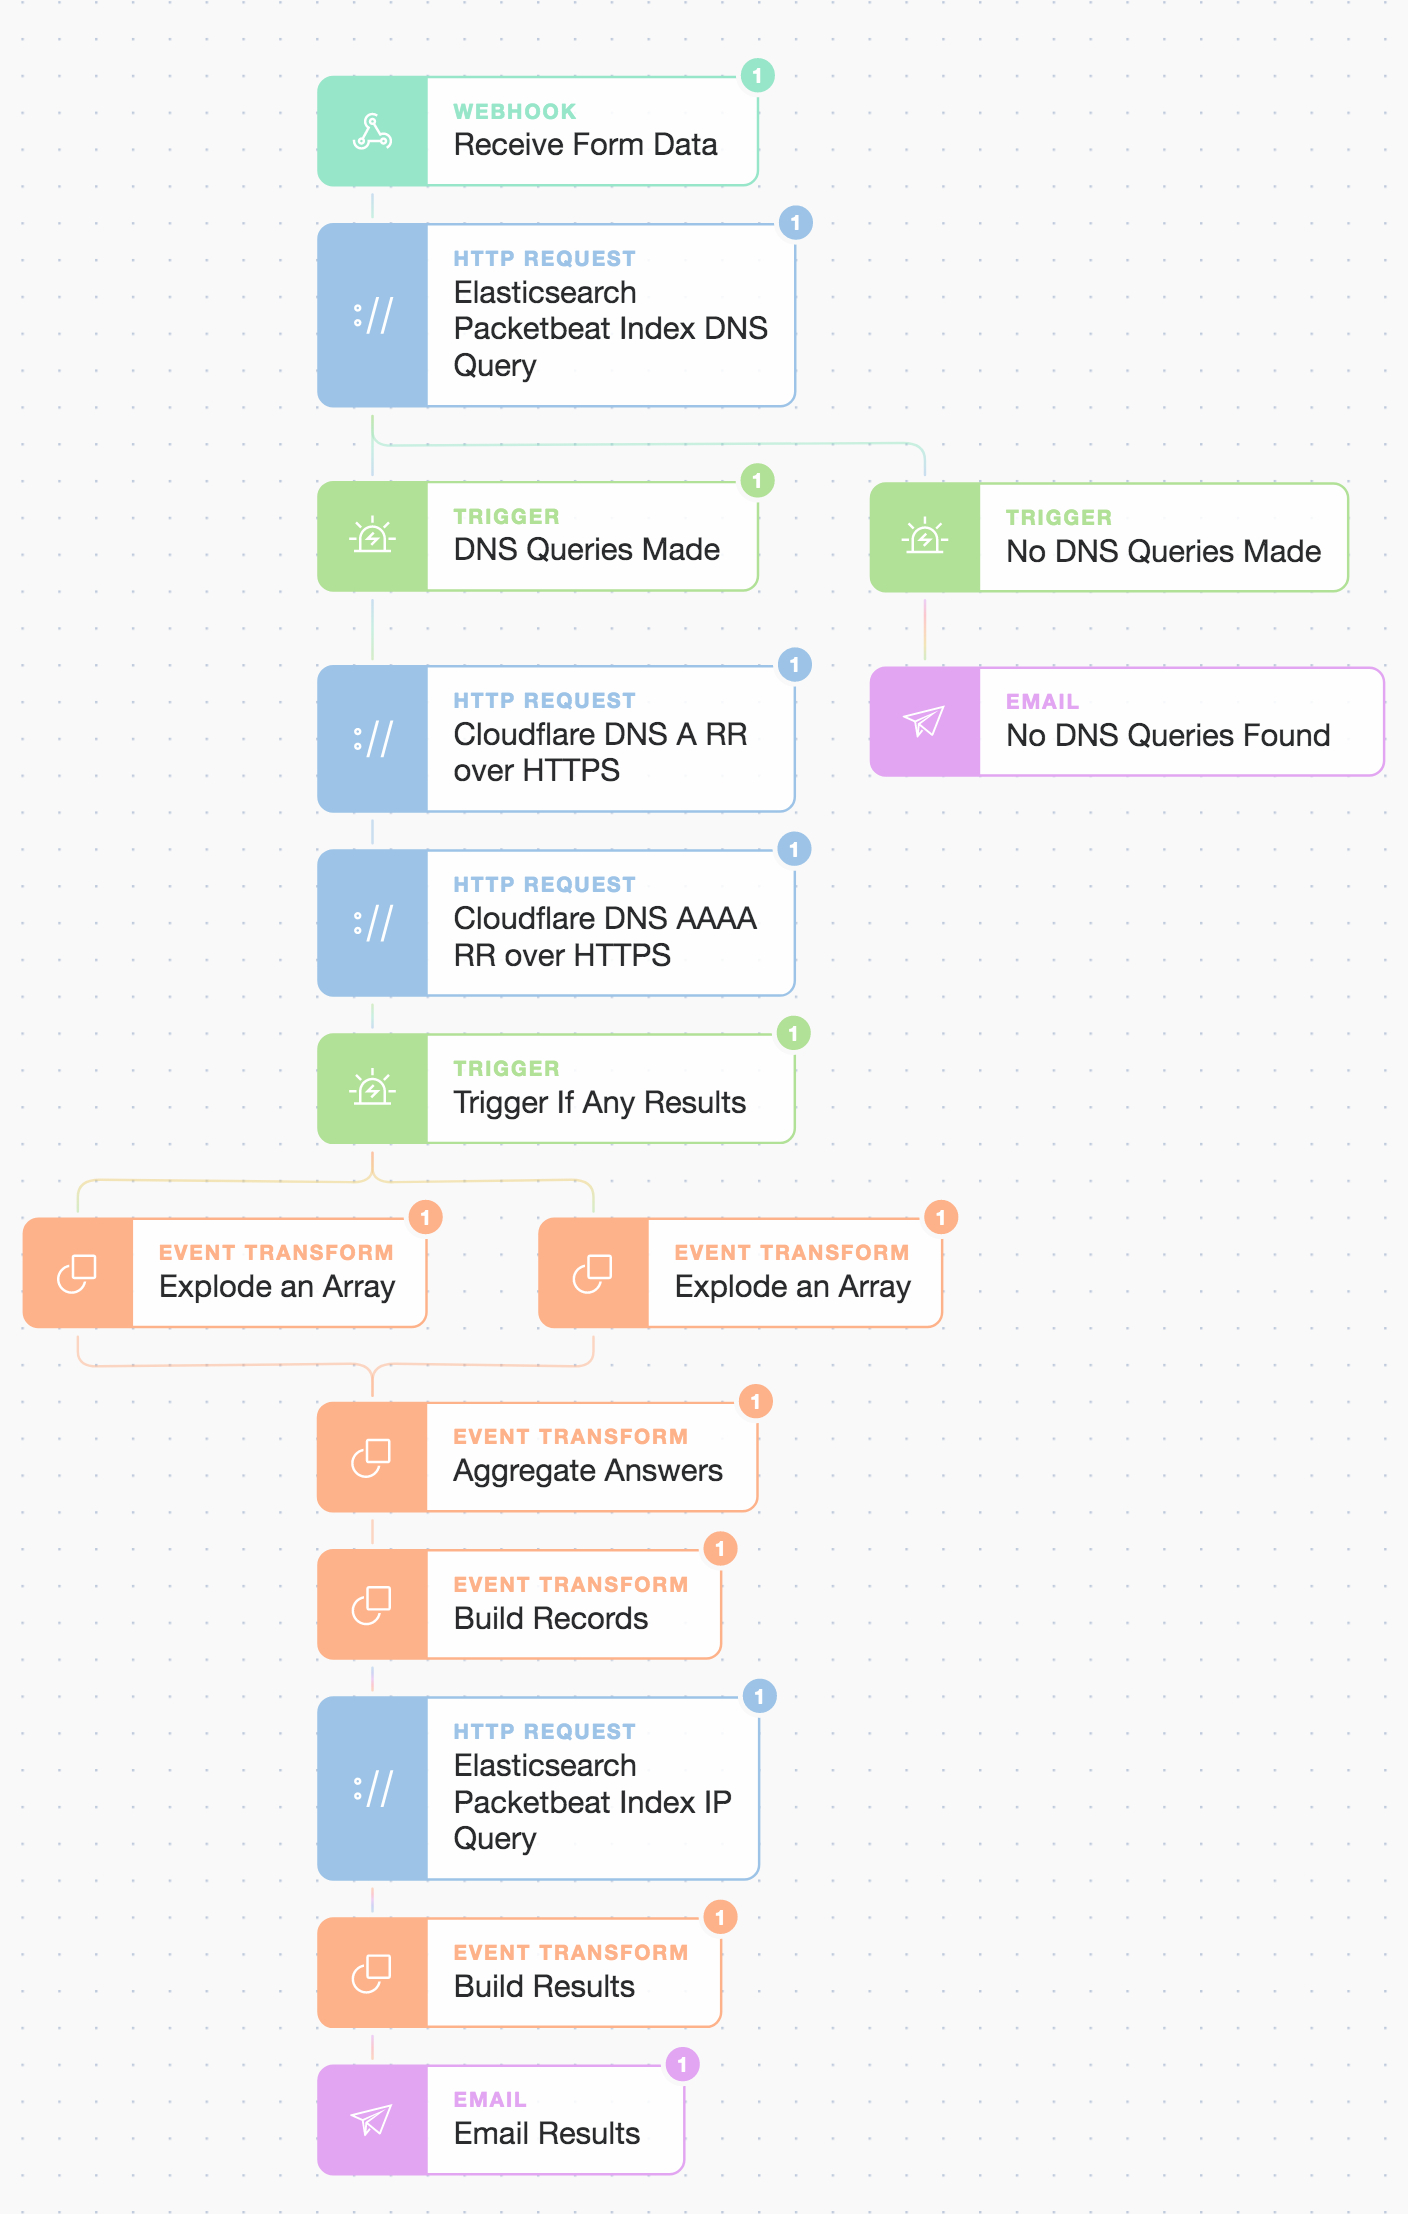
OK, so now let’s look at how we join up these Actions (including how to query Cloudflare) and then make a few simple logic decisions using what we call Trigger and Event Transformation Actions. We will also drag in a Webhook Action, which will be used to start our automation workflow.
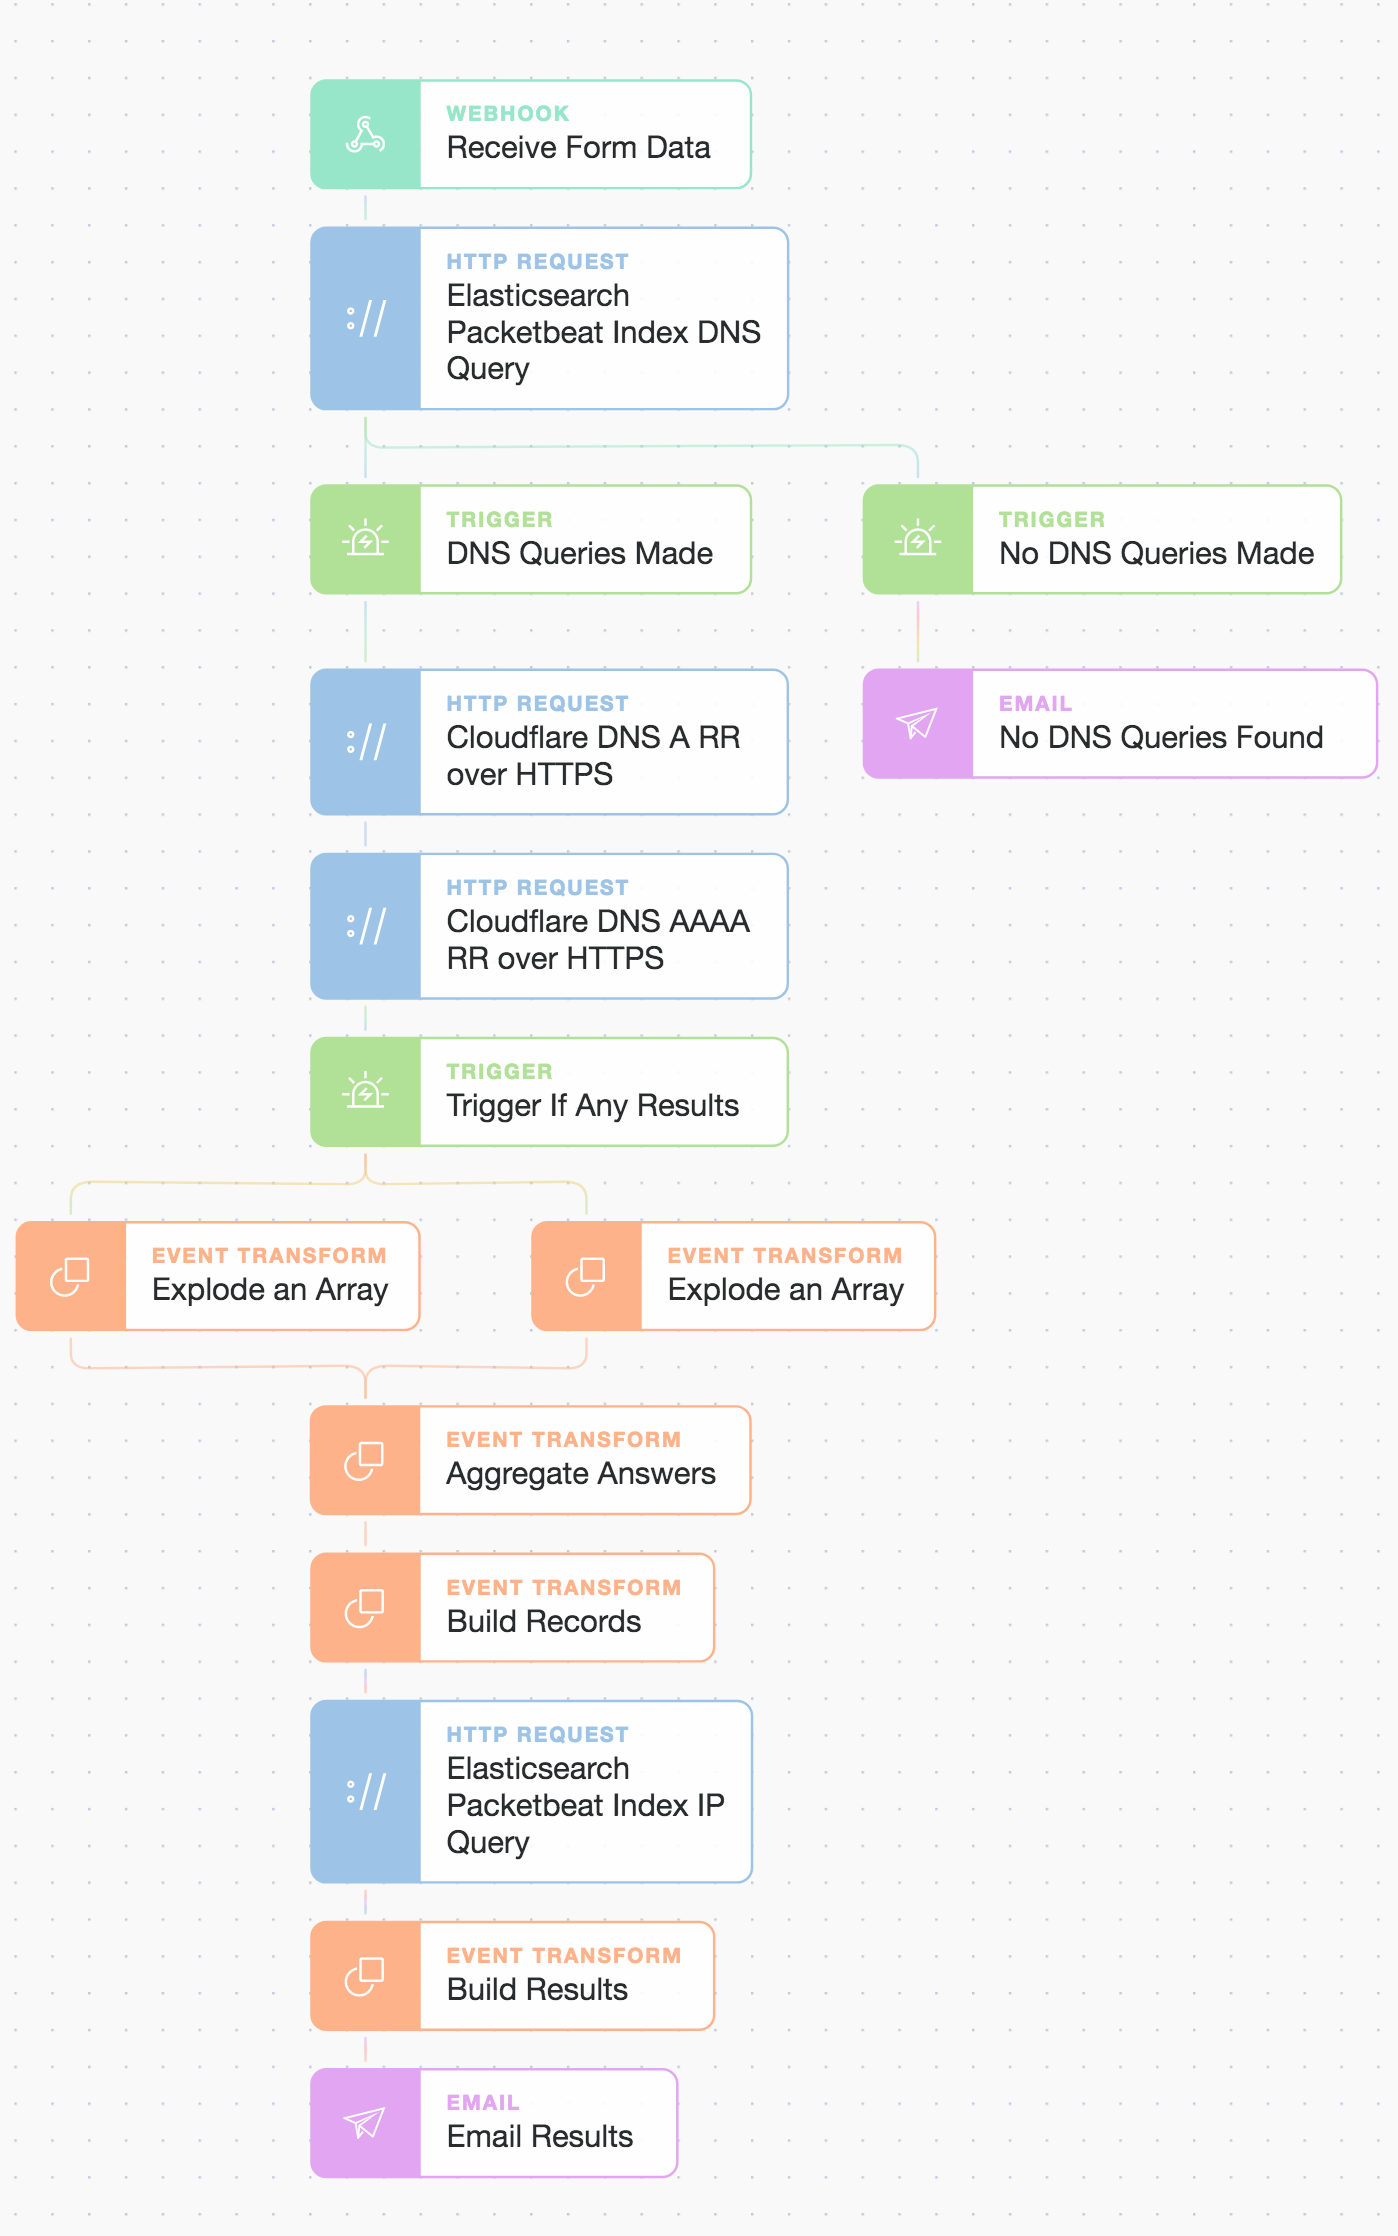
Tines : Combination full story workflow to chain events and present results.
As you can see, we now use triggers to ensure we continue our Story only if there are search hits received from Elasticsearch (otherwise, we send an email to say we could not find anything). We use a few Event Transform Actions to massage the search results returned and also aggregate the Cloudflare DoH (DNS over HTTPS) responses as we want to search for all resolved IPs.
The email we receive from our query for ‘cisco.com’ looks like:
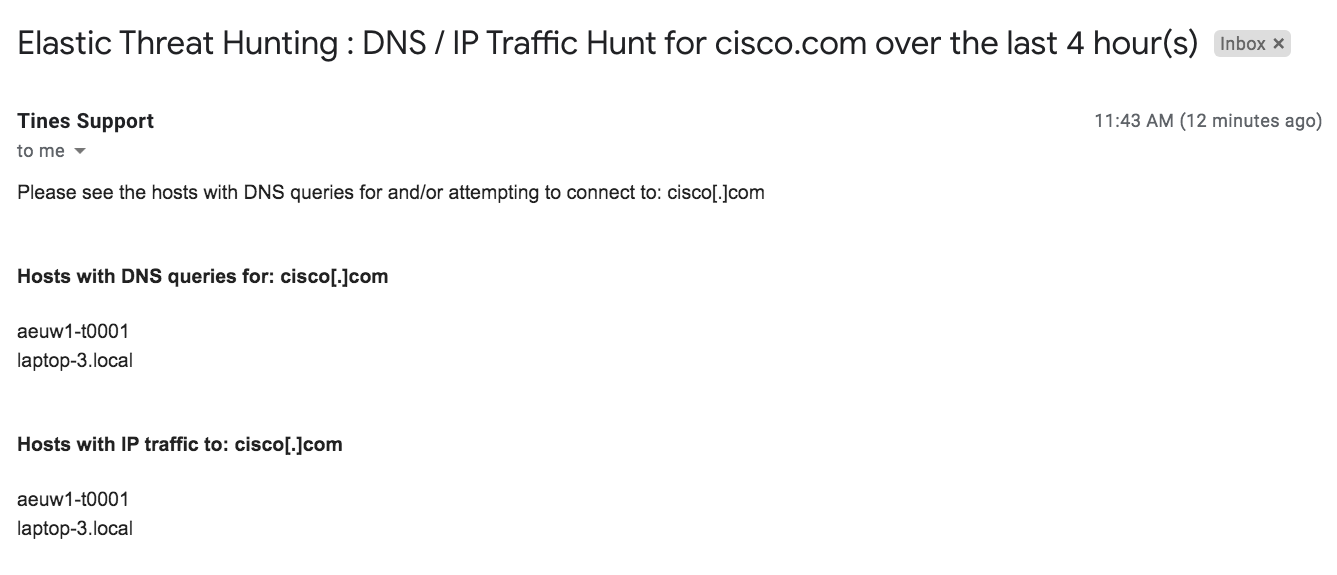
Tines : Email results, including one server and one laptop.
But how do we kick off this workflow and make it easily consumable by others? Well, because we initiate it with a Webhook Action, we can call it from other automation stories or remote systems. We can even drop a simple form in front of it with Tines in seconds. Tines has a simple form builder that allows you to auto-select any live Webhook Action in your Story as an entry point. Let’s quickly generate a form for our colleagues (we can choose a private or public link to give them, so let’s keep it private for now):
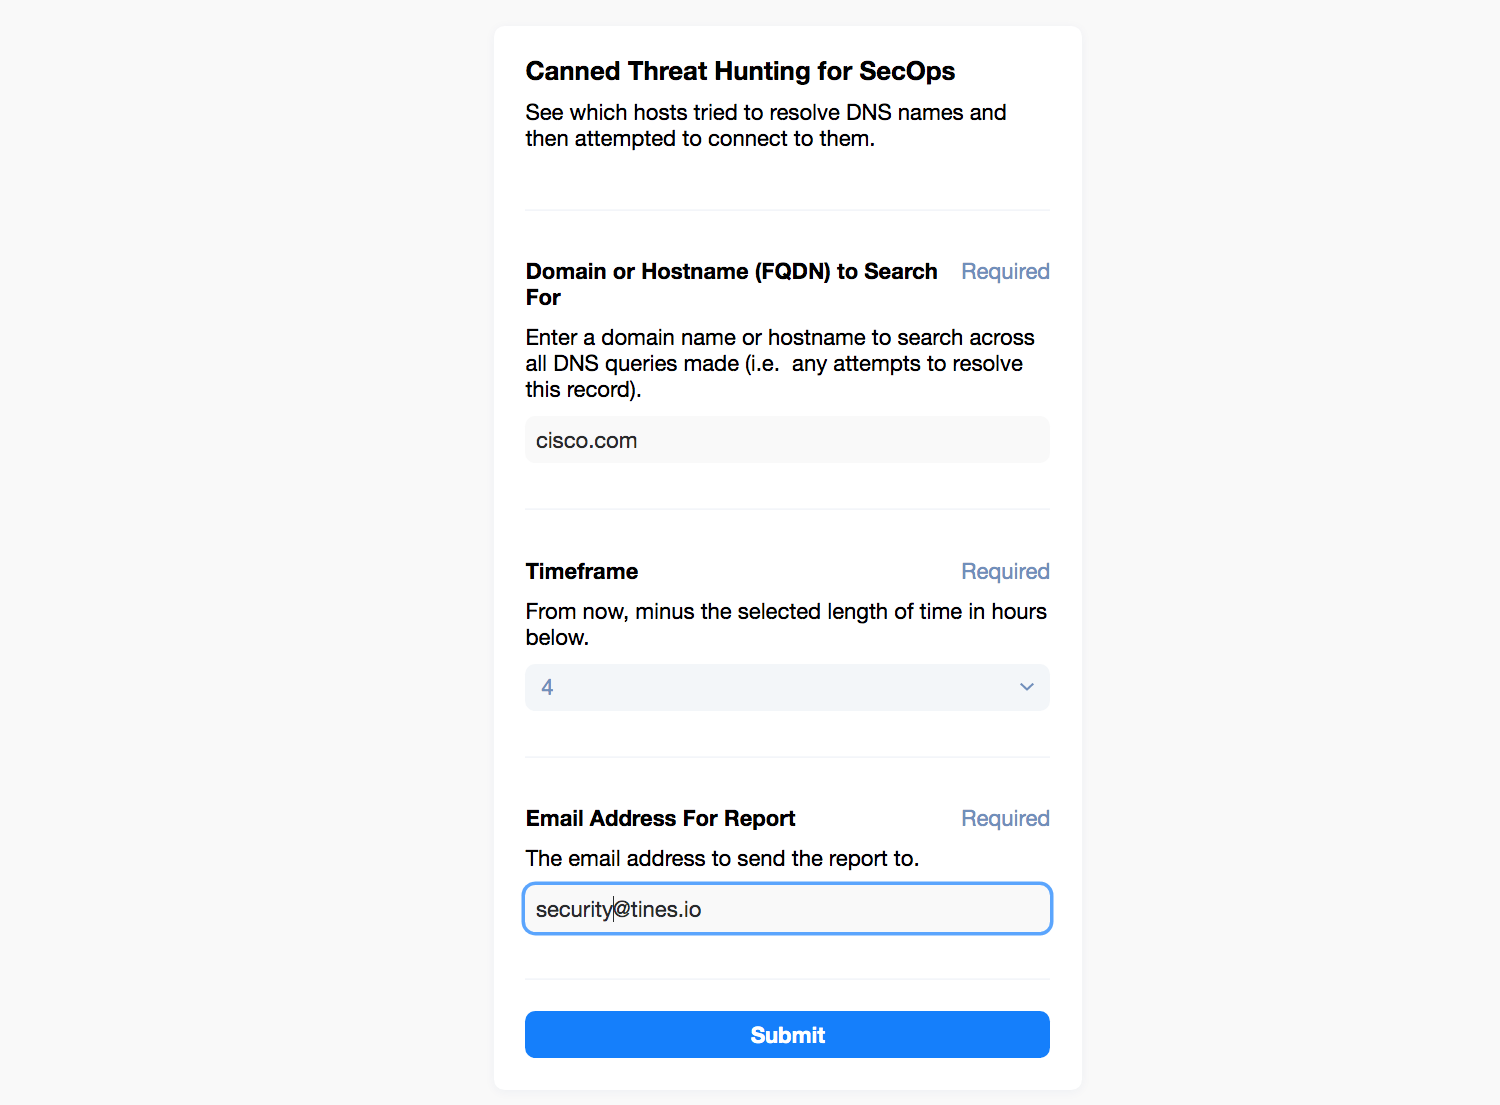
Tines : Simple three field page to start the automation.
And now, when we submit the page, it runs the automation for us!
Tines : From a page to an automation outcome!
Wrap Up
We’ve seen how to use the Elasticsearch Search API and Tines to wrap pieces of functionality into straightforward and useful automation. These automation stories can grow as complex as you wish and involve tens if not hundreds of Actions performing tasks with all manner of services and endpoints. Stories can also be modularized to form reusable sub-stories by using the Send To Story Action type (which also makes good use of the Webhook Action type!).
The above simple Story can be downloaded here if you’d like to experiment and play around with it. It only takes a few minutes to get going! You can, of course, construct your own Story or modify the workflow for your own needs. You can add Actions from the library of thousands of Action templates that ship with Tines. Maybe it's time to drive security outcomes by automating your operational logic.
Assure yourself what's next!